Market Commentary – October 2025
as of 10.31.2025
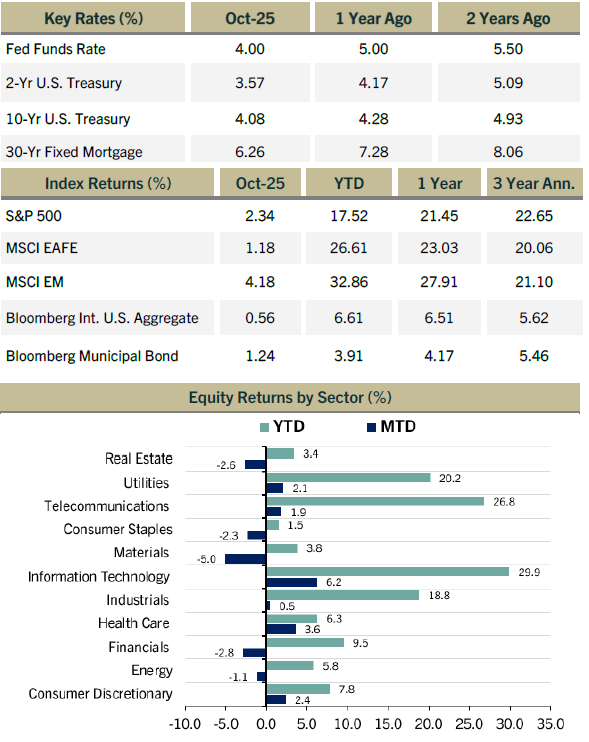
- The S&P 500 keeps grinding higher with October up another 2.34%, marking the sixth consecutive positive monthly return. Growth led value for the second consecutive month and is outperforming YTD by a whopping 12.58% (23.50% vs. 10.92%) as the AI boom continues to deliver outsized returns for the Magnificent 7.
- Fixed income markets were also positive with the Municipal Bond Index up 1.24% compared to US Treasuries and the US Intermediate Ag that were up 0.62% and 0.56%, respectively.
- The Fed voted to cut interest rates another 25 bps in October bringing the benchmark rate to 3.75%-4.00%. Two Governors dissented this time, but in opposite directions with one voting again to cut rates by 50 bps and another voting to leave rates unchanged. The diverging views serves to highlight the challenge the Fed faces, which is elevated inflation and weakening job growth.
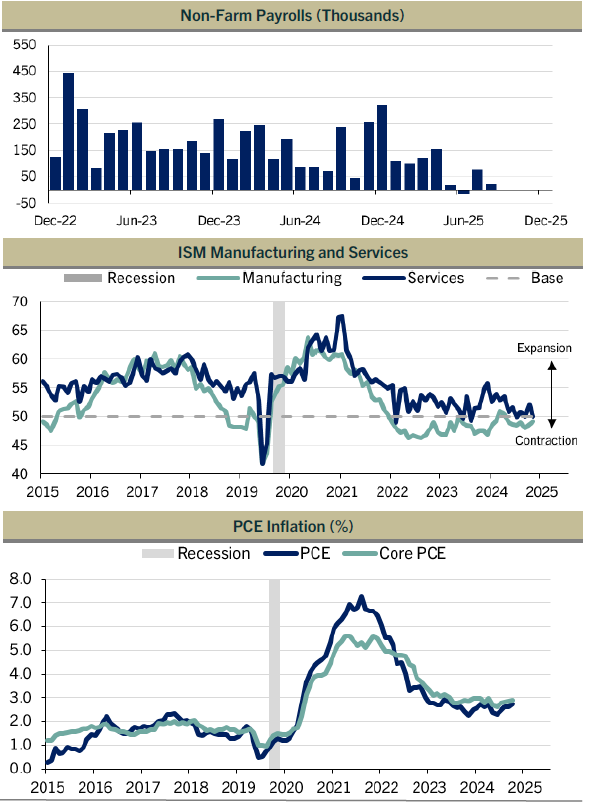
- While the reporting was delayed, September CPI came in at 0.31% and core CPI was 0.23%. Inflation was a bit lower than expected but remains around 3%. The White House has indicated that the October inflation data may not be released so we may be waiting until December for the next CPI report.
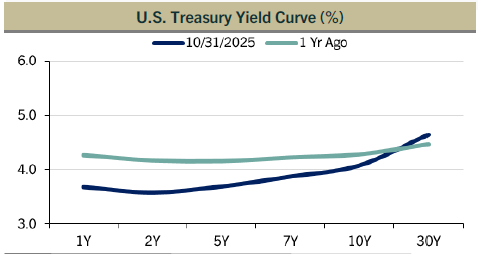
- Perhaps more importantly, Fed Chair Jerome Powell’s commentary during the press conference suggested that a rate cut in December “is not a foregone conclusion, far from it” causing the bond market to sell off as traders began to reduce the odds of a third consecutive 25 bps cut.
- The federal government shutdown is the second longest in history (11/5 will set the record). As a result, data remains difficult to come by and makes the FOMC’s job even harder as they assess economic conditions going into their December meeting. Missing reports include the September jobs report, certain inflation data, and Q3 GDP numbers.
- For those dependent on welfare programs, the lengthy government shutdown is leading to financial hardship. SNAP (Supplemental Nutrition Assistance Program), which helps 41 million Americans, ceased issuing benefits as of Nov. 1 and other welfare programs are facing difficulties in maintaining benefits as time goes on.
- The slump in manufacturing has extended to eight consecutive months and while the pace of contraction was not as broad based as the previous month, sentiment offers no sign of improvement given continued weak demand, tepid employment, and higher input prices.
- Existing home sales have been running about 25% below the pre-pandemic, five-year average, hindered by affordability concerns as both prices and mortgage rates remain relatively elevated. Favorably, the 30-year fixed mortgage rate declined by 68 bps from early June to late October according to Freddie Mac. While this should help modestly, mortgage rates near 6% may not be low enough to entice homeowners to move and give up their sub-3% interest rates.
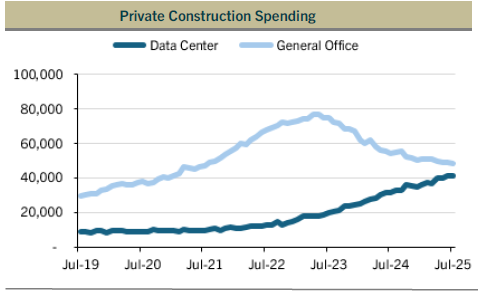
- The office property market appears to be recovering after several years of post-COVID pressure as return to office mandates take a more meaningful hold. In fact, August marked the first year-over-year increase in three years (+0.7%). To be sure, the recovery is asymmetrical with certain hard-hit areas like New York City and San Francisco showing particular strength and premium buildings outperforming less desirable ones.
- Based on 317 of the 499 companies reporting through October, third quarter earnings has seen an average surprise of +4.8% and an average earnings annual growth of +10.3%.
- Nvidia Corp, Apple Inc, and Amazon.com Inc were the top three contributors to return for the S&P 500 in October whereas Meta Platforms Inc, Berkshire Hathaway Inc, and Fiserv Inc were the biggest detractors.
Firm Definition and Contact Information
Maple Capital Management, Inc. (MCM) is an independent SEC Registered Investment Advisor with offices in Montpelier, Vermont and Atlanta, Georgia.
This commentary reflects the views of MCM and should not be considered to be investment or financial advice. MCM does not warranty these views and will not update this communication after the date of publication. Any mention of specific securities is done for illustrative purposes and the securities mentioned may or may not be held in client accounts. No assumption or assurance should be taken that securities mentioned will be safe or profitable investments. Past performance is not indicative of future results
For further information, please contact David Bosworth at 1-802-229-2838 or at [email protected]. For further information about Maple Capital, including a copy of our informational brochure, please visit our website at www.maplecapital.com.
Index Definitions
The S&P 500 (S&P 500) Total Return is a market capitalization-weighted index composed of the 500 most widely held stocks whose assets and/or revenues are based in the US; it’s often used as a proxy for the U.S. stock market. TR (Total Return) indexes include daily reinvestment of dividends.
MSCI EAFE Total Return Net is the Morgan Stanley Capital International Europe, Australia, and Far East index that is a market-capitalization-weighted index of 21 non-U.S. industrialized country indexes. The index includes net dividends reinvested minus-tax-credit calculations, but subtracts withholding taxes retained at the source for foreigners who do not benefit from a double taxation treaty.
The MSCI Emerging Markets (MSCI EM) Index captures large and mid cap representation across 27 Emerging Markets (EM) countries.
Bloomberg Municipal Bond Index Total Return Index Value Unhedged USD (Municipal Bond Index) covers the US-denominated long-term tax exempt bond market. The index has four main sectors: state and local general obligation bonds, revenue bonds, insured bonds and prerefunded bonds.
The Bloomberg Intermediate U.S. Aggregate Bond Index is a broad-based flagship benchmark that measures the performance of investment grade, U.S. dollar-denominated, fixed-rate taxable bond market with less than 10 years to maturity. The securitized sector includes Treasuries, government-related and corporate securities, MBS (agency fixed-rate and hybrid ARM pass-throughs), ABS, and CMBS.
The federal funds rate is the interest rate at which depository institutions trade federal funds (balances held at Federal Reserve Banks) with each other overnight. When a depository institution has surplus balances in its reserve account, it lends to other banks in need of larger balances. In simpler terms, a bank with excess cash, which is often referred to as liquidity, will lend to another bank that needs to quickly raise liquidity. (1) The rate that the borrowing institution pays to the lending institution is determined between the two banks; the weighted average rate for all of these types of negotiations is called the effective federal funds rate.(2) The effective federal funds rate is essentially determined by the market but is influenced by the Federal Reserve through open market operations to reach the federal funds rate target. All Key Rates and Returns by Index are quoted out of Bloomberg.
The CPI Index represents changes in prices of all goods and services purchases for consumption by urban households. Retail Gas Prices are provided by AAA using data from up to 120,000 retail stations. West Texas Intermediate (WTI) crude oil is a specific grade of crude oil and one of the main three benchmarks in oil pricing, along with Brent and Dubai Crude.
Equity Returns by Sector are based on the GICS methodology. Return data are calculated by Bloomberg using constituents and weights as provided by Standard & Poor’s. Returns are cumulative total return for stated period, including reinvestment of dividends.
Chart Definitions
The Services and Manufacturing PMI from the Institute for Supply Management (ISM) is a composite index based on the diffusion indexes for four of the indicators with equal weights: Business Activity (seasonally adjusted), New Orders (seasonally adjusted), Employment (seasonally adjusted) and Supplier Deliveries. The Manufacturing PMI is a composite index based on the diffusion indexes of five of the indexes with equal weights: New Orders (seasonally adjusted), Production (seasonally adjusted), Employment (seasonally adjusted), Supplier Deliveries, and Inventories (seasonally adjusted). Diffusion indexes have the properties of leading indicators and are convenient summary measures showing the prevailing direction of change and the scope of change. An index reading above 50 percent indicates that the services economy is generally expanding; below 50 percent indicates that it is generally declining. Supplier Deliveries is an exception. A Supplier Deliveries Index above 50 percent indicates slower deliveries and below 50 percent indicates faster deliveries.
The PCE Price Index Excluding Food and Energy, also known as the core PCE price index, is released as part of the monthly Personal Income and Outlays report. The core index makes it easier to see the underlying inflation trend by excluding two categories – food and energy – where prices tend to swing up and down more dramatically and more often than other prices. The core PCE price index is closely watched by the Federal Reserve as it conducts monetary policy. The PCE price index, released each month in the Personal Income and Outlays report, reflects changes in the prices of goods and services purchased by consumers in the United States. Quarterly and annual data are included in the GDP release.
Total Nonfarm, commonly known as Total Nonfarm Payroll, is a measure of the number of U.S. workers in the economy that excludes proprietors, private household employees, unpaid volunteers, farm employees, and the unincorporated self-employed. This measure accounts for approximately 80 percent of the workers who contribute to Gross Domestic Product (GDP).
The diffusion non-farm payrolls chart are based on the percent of industries with employment increasing plus one-half the industries unchanged employment, where 50% indicates an equal balance between industries with increasing and decreasing employment.
Disclaimer
This document is a general communication being provided for informational purposes only. It is educational in nature and not designed to be taken as advice or a recommendation for any specific investment product, strategy, plan feature or other purpose in any jurisdiction. This material does not contain sufficient information to support an investment decision and it should not be relied upon by you in evaluating the merits of investing in any securities or products. In addition, users should make an independent assessment of the legal, regulatory, tax, credit, and accounting implications and determine, together with their own financial professional, if any investment mentioned herein is believed to be appropriate to their financial situation and investment profile. Investors should ensure that they obtain all available relevant information before making any investment. It should be noted that investments involve risks, the value of investments and the income from them may fluctuate in accordance with market conditions and taxation agreements and investors may not get back the full amount invested. Both past performance and yields are not reliable indicators of current and future results. All information presented herein is considered to be accurate at the time of production, but no warranty of accuracy is given and no liability in respect of any error or omission is accepted.
Past performance does not guarantee future results. Diversification does not guarantee investment returns and does not eliminate the risk of loss.
www.maplecapital.com | 535 Stone Cutters Way, Montpelier, VT 05602 | Toll Free: 800.255.9946
The post Market Commentary – October 2025 appeared first on Maple Capital Management.