Market Commentary – November 2025
as of 11.30.2025
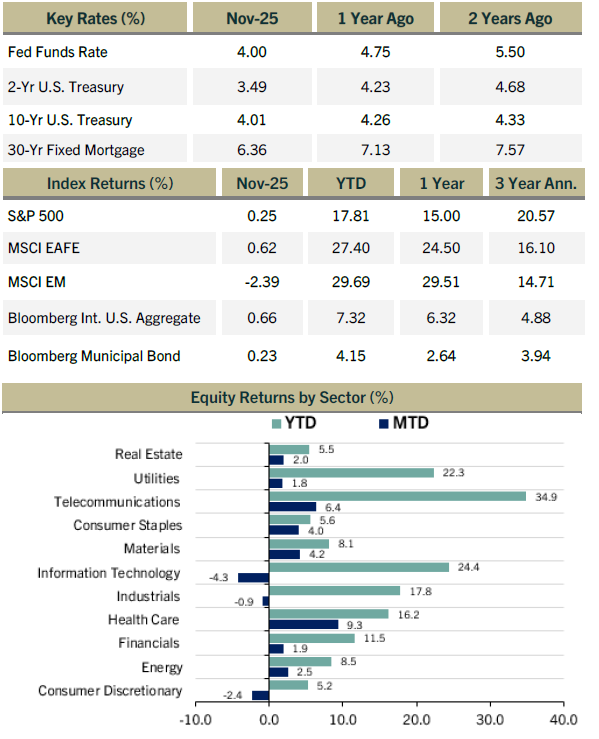
- The S&P 500 eked out a minor gain in November of 0.25%, marking the seventh consecutive positive monthly return. Growth trailed value for the month, however, as investors began questioning the magnitude of the AI investment boom. Another sign of the change in sentiment is the performance of the S&P 500 Equal Weight Index, which beat the S&P 500 Index by 1.65% for the month. This demonstrates the shift in market sentiment away from the tech titans, at least for the moment.
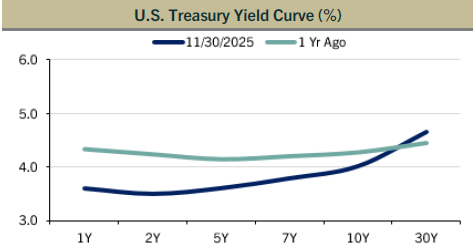
- Bond yields moved lower in the month, which generated positive total return. The Municipal Bond Index and the US Intermediate Ag were up 0.23% and 0.66%, respectively.
- One of the main catalysts for lower bond yields was a comment from NY Fed President John Williams, a key leader within the FOMC, indicating he favors another rate cut in December. Based on other comments from Fed policymakers, there appears to be a fair amount of divergence of opinion. Some favor a pause due to the persistent inflation threat, while others see the risks to the labor market as more of a threat. Market pricing indicates a rate cut is highly probable on December 10.
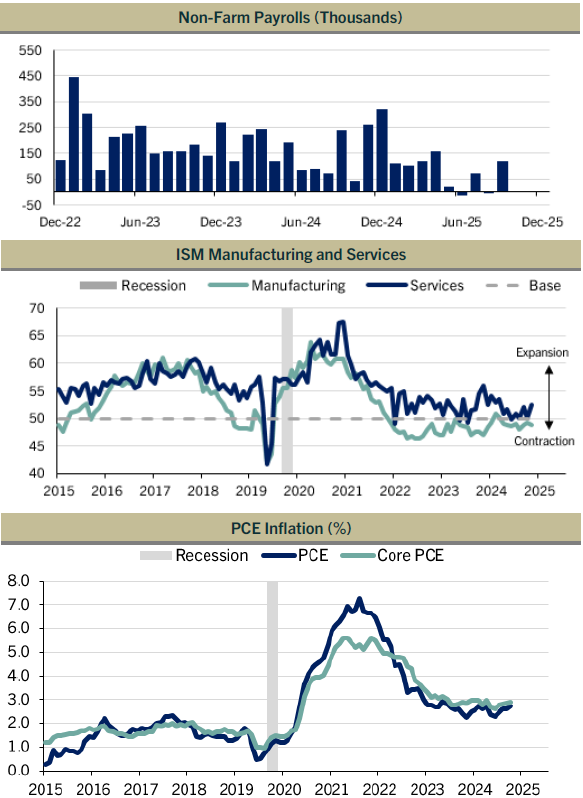
- With the end of the federal government shutdown, official economic reports began flowing again in November. One of the more closely-watched reports, the monthly payroll report, showed mixed results for the month of September. The headline job gain of 119K was better than expected, but the unemployment rate ticked up to 4.4%, the highest since October of 2021. Monthly wage gains were slower, which could be seen as a sign of growing slack in the demand for labor if employers are not having to raise wages. Finally, the prior two months of payrolls were revised lower — plenty of fodder for hawks and doves alike.
- Beyond the September payroll report, private data sources such as the weekly ADP update displayed weak results in recent weeks. In addition, layoff announcements for October were the highest in years at close to one million. When combined with a weaker retail sales report, this set of data helped keep a bid for Treasuries during the month.
- With a large percentage of the companies in the S&P 500 Index having reported results for the third quarter, year-over-year earnings growth now stands at 14.6%, which is almost double what was expected. Even excluding the “Magnificent Seven,” earnings growth is at 10.8%, indicating the corporate earnings momentum is broad-based. Indeed, nearly 82% of reporters beat earnings estimates, above the three-year average of 78.4%.
- Regardless of these impressive results, the market turned its attention on the massive scale of capital expenditure investment being made by the technology and other sectors to build out the AI infrastructure, primarily consisting of data centers and the gear they require. Large tech companies have been issuing debt more regularly to fund this expansion, where previously most of the capex was internally funded with cashflow.
- According to JP Morgan, the global data center and AI buildout, including related power supplies, could cost over $5 trillion by 2030. One estimate even has this figure costing $7 trillion. Clearly, this level of investment will require multiple sources of funding if not a bit of creativity and innovation as well. This issue will likely continue to merit much discussion into the new year.
- Beyond the buildout of AI infrastructure, the question of monetizing the investment in AI is another critical matter requiring some clarity. Some companies are currently using productivity gains from AI to hire more employees, while others may choose instead to replace existing employees with AI-enabled tools. How all of this transpires will be a multifaceted mosaic that will take years to manifest, but the financial markets will be debating outcomes via price movements.
- Alphabet, Inc., Eli Lilly & Co., and Broadcom, Inc. were the top three contributors to return for the S&P 500 in November whereas Nvidia Corp., Microsoft Corp., and Amazon.com were the biggest detractors.
Firm Definition and Contact Information
Maple Capital Management, Inc. (MCM) is an independent SEC Registered Investment Advisor with offices in Montpelier, Vermont and Atlanta, Georgia.
This commentary reflects the views of MCM and should not be considered to be investment or financial advice. MCM does not warranty these views and will not update this communication after the date of publication. Any mention of specific securities is done for illustrative purposes and the securities mentioned may or may not be held in client accounts. No assumption or assurance should be taken that securities mentioned will be safe or profitable investments. Past performance is not indicative of future results
For further information, please contact David Bosworth at 1-802-229-2838 or at [email protected]. For further information about Maple Capital, including a copy of our informational brochure, please visit our website at www.maplecapital.com.
Index Definitions
The S&P 500 (S&P 500) Total Return is a market capitalization-weighted index composed of the 500 most widely held stocks whose assets and/or revenues are based in the US; it’s often used as a proxy for the U.S. stock market. TR (Total Return) indexes include daily reinvestment of dividends.
MSCI EAFE Total Return Net is the Morgan Stanley Capital International Europe, Australia, and Far East index that is a market-capitalization-weighted index of 21 non-U.S. industrialized country indexes. The index includes net dividends reinvested minus-tax-credit calculations, but subtracts withholding taxes retained at the source for foreigners who do not benefit from a double taxation treaty.
The MSCI Emerging Markets (MSCI EM) Index captures large and mid cap representation across 27 Emerging Markets (EM) countries.
Bloomberg Municipal Bond Index Total Return Index Value Unhedged USD (Municipal Bond Index) covers the US-denominated long-term tax exempt bond market. The index has four main sectors: state and local general obligation bonds, revenue bonds, insured bonds and prerefunded bonds.
The Bloomberg Intermediate U.S. Aggregate Bond Index is a broad-based flagship benchmark that measures the performance of investment grade, U.S. dollar-denominated, fixed-rate taxable bond market with less than 10 years to maturity. The securitized sector includes Treasuries, government-related and corporate securities, MBS (agency fixed-rate and hybrid ARM pass-throughs), ABS, and CMBS.
The federal funds rate is the interest rate at which depository institutions trade federal funds (balances held at Federal Reserve Banks) with each other overnight. When a depository institution has surplus balances in its reserve account, it lends to other banks in need of larger balances. In simpler terms, a bank with excess cash, which is often referred to as liquidity, will lend to another bank that needs to quickly raise liquidity. (1) The rate that the borrowing institution pays to the lending institution is determined between the two banks; the weighted average rate for all of these types of negotiations is called the effective federal funds rate.(2) The effective federal funds rate is essentially determined by the market but is influenced by the Federal Reserve through open market operations to reach the federal funds rate target. All Key Rates and Returns by Index are quoted out of Bloomberg.
The CPI Index represents changes in prices of all goods and services purchases for consumption by urban households. Retail Gas Prices are provided by AAA using data from up to 120,000 retail stations. West Texas Intermediate (WTI) crude oil is a specific grade of crude oil and one of the main three benchmarks in oil pricing, along with Brent and Dubai Crude.
Equity Returns by Sector are based on the GICS methodology. Return data are calculated by Bloomberg using constituents and weights as provided by Standard & Poor’s. Returns are cumulative total return for stated period, including reinvestment of dividends.
Chart Definitions
The Services and Manufacturing PMI from the Institute for Supply Management (ISM) is a composite index based on the diffusion indexes for four of the indicators with equal weights: Business Activity (seasonally adjusted), New Orders (seasonally adjusted), Employment (seasonally adjusted) and Supplier Deliveries. The Manufacturing PMI is a composite index based on the diffusion indexes of five of the indexes with equal weights: New Orders (seasonally adjusted), Production (seasonally adjusted), Employment (seasonally adjusted), Supplier Deliveries, and Inventories (seasonally adjusted). Diffusion indexes have the properties of leading indicators and are convenient summary measures showing the prevailing direction of change and the scope of change. An index reading above 50 percent indicates that the services economy is generally expanding; below 50 percent indicates that it is generally declining. Supplier Deliveries is an exception. A Supplier Deliveries Index above 50 percent indicates slower deliveries and below 50 percent indicates faster deliveries.
The PCE Price Index Excluding Food and Energy, also known as the core PCE price index, is released as part of the monthly Personal Income and Outlays report. The core index makes it easier to see the underlying inflation trend by excluding two categories – food and energy – where prices tend to swing up and down more dramatically and more often than other prices. The core PCE price index is closely watched by the Federal Reserve as it conducts monetary policy. The PCE price index, released each month in the Personal Income and Outlays report, reflects changes in the prices of goods and services purchased by consumers in the United States. Quarterly and annual data are included in the GDP release.
Total Nonfarm, commonly known as Total Nonfarm Payroll, is a measure of the number of U.S. workers in the economy that excludes proprietors, private household employees, unpaid volunteers, farm employees, and the unincorporated self-employed. This measure accounts for approximately 80 percent of the workers who contribute to Gross Domestic Product (GDP).
The diffusion non-farm payrolls chart are based on the percent of industries with employment increasing plus one-half the industries unchanged employment, where 50% indicates an equal balance between industries with increasing and decreasing employment.
Disclaimer
This document is a general communication being provided for informational purposes only. It is educational in nature and not designed to be taken as advice or a recommendation for any specific investment product, strategy, plan feature or other purpose in any jurisdiction. This material does not contain sufficient information to support an investment decision and it should not be relied upon by you in evaluating the merits of investing in any securities or products. In addition, users should make an independent assessment of the legal, regulatory, tax, credit, and accounting implications and determine, together with their own financial professional, if any investment mentioned herein is believed to be appropriate to their financial situation and investment profile. Investors should ensure that they obtain all available relevant information before making any investment. It should be noted that investments involve risks, the value of investments and the income from them may fluctuate in accordance with market conditions and taxation agreements and investors may not get back the full amount invested. Both past performance and yields are not reliable indicators of current and future results. All information presented herein is considered to be accurate at the time of production, but no warranty of accuracy is given and no liability in respect of any error or omission is accepted.
Past performance does not guarantee future results. Diversification does not guarantee investment returns and does not eliminate the risk of loss.
www.maplecapital.com | 535 Stone Cutters Way, Montpelier, VT 05602 | Toll Free: 800.255.9946
The post Market Commentary – November 2025 appeared first on Maple Capital Management.