Market Commentary – April 2026
as of 04.30.2026
- The equity market posted a strong rebound in April, with the S&P 500 up 10.49%. This was the best monthly gain since 2020, supported by strong corporate earnings despite geopolitical risks.
- The strong equity performance was not without volatility, as price action reacted to swings in oil prices and Fed expectations. However, periods of declines were followed by sharp rallies that brought the S&P to a record high, surpassing the 7,000 milestone for the first time ever.
- Alphabet Inc, Nvidia Corp, and Amazon.com Inc were the top three contributors to return for the S&P 500 in April whereas Exxon Mobil Corp, Johnson & Johnson, and Chevron Corp were the biggest detractors.
- Demand for artificial intelligence was back in play as some of the large players in the Communication Services and Tech Sectors helped drive performance. The Communication Services Sector was up 18.54% in April and the Tech Sector was up 17.47%. As an example, Alphabet Inc reported earnings on the last day of the quarter and had strong results, contributing a total of 178 bps to overall S&P return for April.
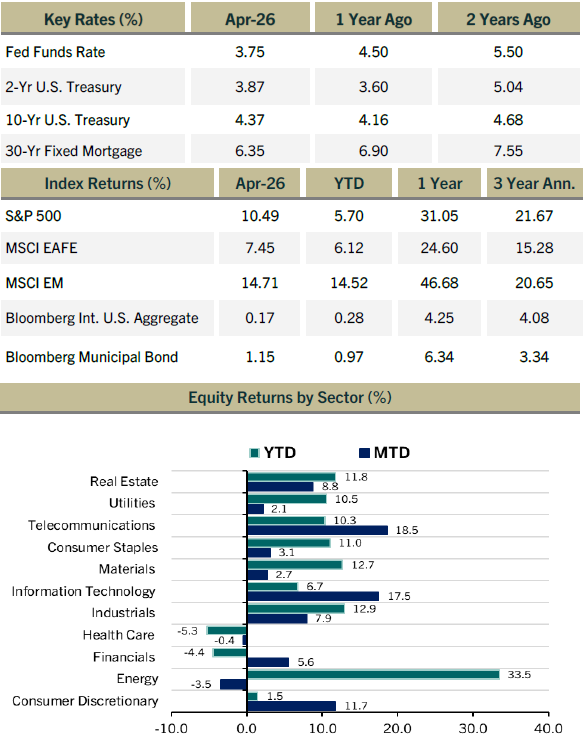
- The U.S. Intermediate Agg bond index rose 11bps with the short-end outperforming the long-end. U.S. Treasuries were modestly negative, losing 7bps, while the Municipal Bond index returned a relatively strong 115bps, in part due to strong inflows. YTD municipal bond flows hit nearly $30bn, representing the third-highest level since 1992.
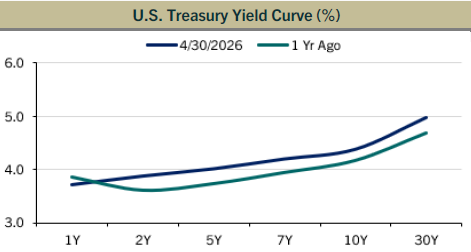
- Treasury yields were highly volatile throughout April, falling early in the month before rising again as inflation risks re-emerged.
- Oil prices were especially unpredictable, with large swings occurring frequently, including a drop from $109 to $95 in a single session. Brent ended the month at $114 but had hit an intraday of $126 during April.
- Q126 GDP growth was slightly below expectations with the economy expanding by 2.0%. Growth was driven by business investment and government spending while consumer spending slowed.
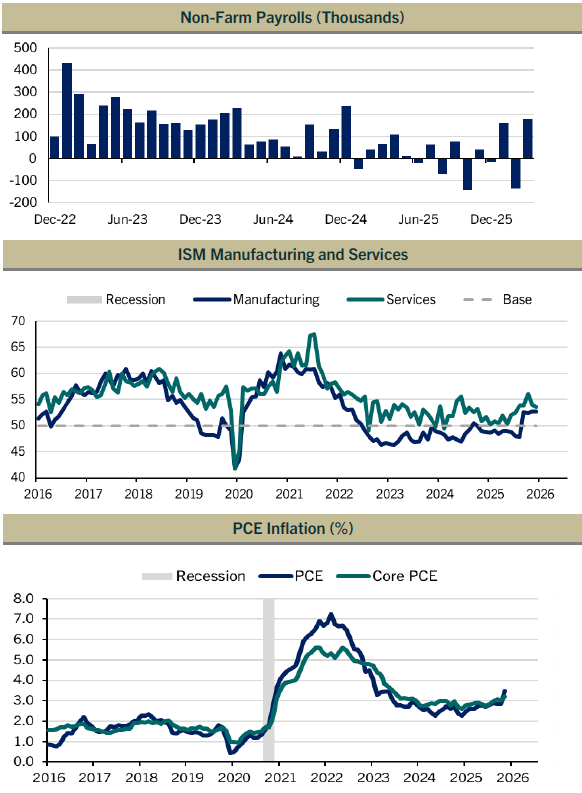
- The labor market continued to show resilience, with the unemployment rate holding at 4.3% despite slower hiring thanks to the lack of layoffs. Initial jobless claims dropped to 189k at the end of the month, the lowest level since the late 1960s.
- The FOMC left interest rates unchanged at 3.50%–3.75% and market expectations are now focused on the potential for a rate hike occurring in early 2027, thanks to persistently higher inflation from energy prices.
- Manufacturing activity remained in expansion (ISM 52.7%), but firms reported sharp increases in input costs, especially tied to energy and supply chains, with the ISM Prices Paid index rising to 84.6, the highest level since April 2022.
- Inflation, as measured by CPI, rose to 3.5% in March, driven by rising energy prices from the energy shock caused by the war in Iran. Core PCE, which is the Fed’s preferred measurement tool rose to 3.2% from 3.0%, indicating that energy is not the only driver.
- U.S. gas prices reached a 4-year high when its average price peaked at $4.18, which is 30-40% higher since early 2026. This is thought to be part of the impact to slower consumer spending.
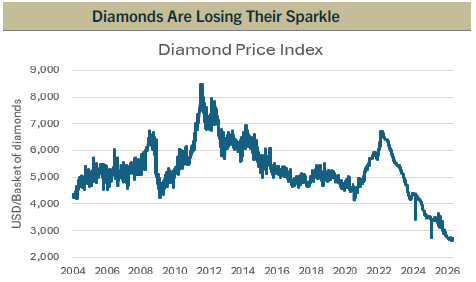
- Precious metals experienced a sharp pullback over the March-April period, with gold and silver posting their largest two-month declines in years, partially due to higher real yields and a strong dollar.
Index Definitions
The S&P 500 (S&P 500) Total Return is a market capitalization-weighted index composed of the 500 most widely held stocks whose assets and/or revenues are based in the US; it’s often used as a proxy for the U.S. stock market. TR (Total Return) indexes include daily reinvestment of dividends.
MSCI EAFE Total Return Net is the Morgan Stanley Capital International Europe, Australia, and Far East index that is a market-capitalization-weighted index of 21 non-U.S. industrialized country indexes. The index includes net dividends reinvested minus-tax-credit calculations, but subtracts withholding taxes retained at the source for foreigners who do not benefit from a double taxation treaty.
The MSCI Emerging Markets (MSCI EM) Index captures large and mid cap representation across 27 Emerging Markets (EM) countries.
Bloomberg Municipal Bond Index Total Return Index Value Unhedged USD (Municipal Bond Index) covers the US-denominated long-term tax exempt bond market. The index has four main sectors: state and local general obligation bonds, revenue bonds, insured bonds and prerefunded bonds.
The Bloomberg Intermediate U.S. Aggregate Bond Index is a broad-based flagship benchmark that measures the performance of investment grade, U.S. dollar-denominated, fixed-rate taxable bond market with less than 10 years to maturity. The securitized sector includes Treasuries, government-related and corporate securities, MBS (agency fixed-rate and hybrid ARM pass-throughs), ABS, and CMBS.
The federal funds rate is the interest rate at which depository institutions trade federal funds (balances held at Federal Reserve Banks) with each other overnight. When a depository institution has surplus balances in its reserve account, it lends to other banks in need of larger balances. In simpler terms, a bank with excess cash, which is often referred to as liquidity, will lend to another bank that needs to quickly raise liquidity. (1) The rate that the borrowing institution pays to the lending institution is determined between the two banks; the weighted average rate for all of these types of negotiations is called the effective federal funds rate.(2) The effective federal funds rate is essentially determined by the market but is influenced by the Federal Reserve through open market operations to reach the federal funds rate target. All Key Rates and Returns by Index are quoted out of Bloomberg.
The CPI Index represents changes in prices of all goods and services purchases for consumption by urban households. Retail Gas Prices are provided by AAA using data from up to 120,000 retail stations. West Texas Intermediate (WTI) crude oil is a specific grade of crude oil and one of the main three benchmarks in oil pricing, along with Brent and Dubai Crude.
Equity Returns by Sector are based on the GICS methodology. Return data are calculated by Bloomberg using constituents and weights as provided by Standard & Poor’s. Returns are cumulative total return for stated period, including reinvestment of dividends.
Chart Definitions
The Services and Manufacturing PMI from the Institute for Supply Management (ISM) is a composite index based on the diffusion indexes for four of the indicators with equal weights: Business Activity (seasonally adjusted), New Orders (seasonally adjusted), Employment (seasonally adjusted) and Supplier Deliveries. The Manufacturing PMI is a composite index based on the diffusion indexes of five of the indexes with equal weights: New Orders (seasonally adjusted), Production (seasonally adjusted), Employment (seasonally adjusted), Supplier Deliveries, and Inventories (seasonally adjusted). Diffusion indexes have the properties of leading indicators and are convenient summary measures showing the prevailing direction of change and the scope of change. An index reading above 50 percent indicates that the services economy is generally expanding; below 50 percent indicates that it is generally declining. Supplier Deliveries is an exception. A Supplier Deliveries Index above 50 percent indicates slower deliveries and below 50 percent indicates faster deliveries.
The PCE Price Index Excluding Food and Energy, also known as the core PCE price index, is released as part of the monthly Personal Income and Outlays report. The core index makes it easier to see the underlying inflation trend by excluding two categories – food and energy – where prices tend to swing up and down more dramatically and more often than other prices. The core PCE price index is closely watched by the Federal Reserve as it conducts monetary policy. The PCE price index, released each month in the Personal Income and Outlays report, reflects changes in the prices of goods and services purchased by consumers in the United States. Quarterly and annual data are included in the GDP release.
Total Nonfarm, commonly known as Total Nonfarm Payroll, is a measure of the number of U.S. workers in the economy that excludes proprietors, private household employees, unpaid volunteers, farm employees, and the unincorporated self-employed. This measure accounts for approximately 80 percent of the workers who contribute to Gross Domestic Product (GDP).
The diffusion non-farm payrolls chart are based on the percent of industries with employment increasing plus one-half the industries unchanged employment, where 50% indicates an equal balance between industries with increasing and decreasing employment.
Disclaimer
This document is a general communication being provided for informational purposes only. It is educational in nature and not designed to be taken as advice or a recommendation for any specific investment product, strategy, plan feature or other purpose in any jurisdiction. This material does not contain sufficient information to support an investment decision and it should not be relied upon by you in evaluating the merits of investing in any securities or products. In addition, users should make an independent assessment of the legal, regulatory, tax, credit, and accounting implications and determine, together with their own financial professional, if any investment mentioned herein is believed to be appropriate to their financial situation and investment profile. Investors should ensure that they obtain all available relevant information before making any investment. It should be noted that investments involve risks, the value of investments and the income from them may fluctuate in accordance with market conditions and taxation agreements and investors may not get back the full amount invested. Both past performance and yields are not reliable indicators of current and future results. All information presented herein is considered to be accurate at the time of production, but no warranty of accuracy is given and no liability in respect of any error or omission is accepted.
Past performance does not guarantee future results. Diversification does not guarantee investment returns and does not eliminate the risk of loss.
www.maplecapital.com | 535 Stone Cutters Way, Montpelier, VT 05602 | Toll Free: 800.255.9946
The post Market Commentary – April 2026 appeared first on Maple Capital Management.